

December 16, 2008
AAR Reports Second Quarter Results - 2008
- $0.51 diluted earnings per share from continuing operations, a 21% increase year over year
- Sales of $354 million, up 14% principally due to acquisitions
- $18.6 million of cash from operations
- Backlog increased to $600 million, up 28% fiscal year-to-date
WOOD DALE, Ill., /PRNewswire-FirstCall/ -- AAR (NYSE: AIR) today reported income from continuing operations of $21.4 million, or $0.51 per diluted share for the second quarter ended November 30, 2008. Second quarter results include a $21.0 million impairment charge related to aircraft and a $22.1 million gain on extinguishment of debt. Sales increased 14% to $353.6 million from $310.6 million in the prior year due to the impact of acquisitions. Organic sales increased 3.5% excluding the Aircraft Sales and Leasing segment.
Sales to defense customers increased 32% and represented 43% of total sales. The growth in sales to defense customers was attributable to strong performance at the Company's mobility business, strength in performance-based logistics programs and the impact of the acquisition of SUMMA Technology. Sales to commercial customers increased 3% year over year, while excluding the Aircraft Sales and Leasing segment, the sales growth to commercial customers was 10%. Sales to commercial customers reflect increased aftermarket part sales and the impact of the acquisition of Avborne Heavy Maintenance, offset by lower sales at the Company's component repair business.
In late November, the Company closed on the sale of its industrial gas turbine business, which had previously been reported as a discontinued operation. The after-tax loss from operations and on sale of the discontinued operation was $1.6 million, resulting in second quarter net income of $19.7 million, or $0.47 per diluted share.
During the second quarter, the Company generated $18.6 million of cash from operations and ended the second quarter with $121.8 million of cash on hand. At November 30, 2008, cash on hand and borrowing capacity available under the Company's credit agreement totaled $281 million. Except for $9.6 million of equipment-related financing due in April 2009, the Company's next significant debt maturity is $42.0 million and is not due until May 15, 2011.
"Overall, I am pleased with our second quarter results which were achieved in a challenging economic environment and as many airlines reduced capacity and credit markets tightened. We generated $18.6 million of cash from operations, achieved a 10.2% operating margin excluding the impact of the aircraft impairment, reduced our long-term indebtedness, continued to win new business and took steps to reduce costs," said David P. Storch, Chairman and Chief Executive Officer of AAR CORP.
Following are the highlights for each segment.
Aviation Supply Chain - Sales grew 1% to $146.1 million for the second quarter and gross profit increased 3% to $36.0 million, resulting in a gross profit margin of 24.6% compared to 24.2% last year. The Company's defense logistics business achieved double-digit sales growth during the second quarter while segment sales were unfavorably impacted by a planned reduction in sales to a major regional airline customer and foreign currency translation. Sales growth was also impacted by weakness at the Company's component repair business in Europe.
Maintenance, Repair and Overhaul - Sales grew 27% to $87.4 million for the second quarter and gross profit increased 36% to $13.5 million, resulting in a gross profit margin of 15.4% compared to 14.4% last year. The sales growth reflects the impact of the acquisition of Avborne Heavy Maintenance (now known as AAR Aircraft Services-Miami) and record results at the Company's landing gear business which benefited from investments in assets and productivity improvement initiatives implemented in prior quarters.
Structures and Systems - Sales grew 44% to $114.7 million for the second quarter and gross profit increased 75% to $18.9 million, resulting in a gross profit margin of 16.4% compared to 13.5% in the prior year. Sales were positively impacted by increased market penetration at Mobility Systems and the acquisition of SUMMA Technology. The gross profit margin improvement was driven by the favorable mix of products sold and improved performance at the Company's cargo systems business. During the second quarter, the Company announced a $115 million contract to manufacture shelters as a subcontractor for BAE Systems for its family of medium tactical vehicles for the U.S. Army, a $40 million contract to manufacture containerized roll in/roll out platforms for the U.S. Army and a $300 million pallet repair contract. The $300 million repair contract is not in the Company's backlog.
Aircraft Sales and Leasing - During the second quarter, the Company performed a comprehensive review of its aircraft portfolio to assess the impact of the economic slowdown and credit crisis on market conditions. Based upon that review, and taking into consideration the desire to improve liquidity and generate cash, the Company made the decision to sell one of its four wholly-owned aircraft which had been acquired before September 11, 2001, and offer two of the remaining three aircraft for sale. There is no outstanding debt associated with the two aircraft now offered for sale. As a result of this decision, the Company recorded a $21 million pre-tax impairment charge to reduce the carrying value of the three aircraft to their net realizable value based on current market conditions. In addition, the Company sold two aircraft from its joint venture portfolio resulting in an increase in earnings from joint ventures. At November 30, 2008, the Company's aircraft position includes 27 aircraft held in joint ventures and seven aircraft held in the Company's wholly-owned portfolio. The Company has not acquired any aircraft for lease since November 2007.
Excluding the impact of the impairment charge associated with the aircraft, the consolidated gross profit margin for the Company was 19.8% and the operating margin was 10.2%. Selling, general and administrative expenses as a percentage of sales increased from 10.0% to 10.8% and includes $0.8 million of severance associated with the elimination of certain positions. Annual savings from these reductions is expected to be approximately $3.6 million. The Company also recognized increased bad debt expense of $1.7 million compared to the prior year. Together, the severance and the increase in the provision unfavorably impacted SG&A as a percent of sales by 70 basis points.
The Company retired $56.6 million of its convertible notes for $33.3 million cash. After taking into consideration unamortized debt issuance costs, the Company recorded a $22.1 million pre-tax gain on settlement of the notes. As a result of these transactions, the number of shares used to calculate diluted earnings per share will be reduced by approximately 500,000 and result in $0.03 accretion to diluted earnings per share on an annual basis.
"The results for the first half of the year reflect our intense focus on execution and maintaining a strong balance sheet and liquidity position." Storch continued, "Since December 1, we have invested in certain assets to support our supply chain customers that will contribute to our results in the second half of the fiscal year and given our backlog and our assessment of the risks and opportunities in our markets, we are encouraged with our prospects."
AAR is a leading provider of products and value-added services to the worldwide aerospace and defense industry. With facilities and sales locations around the world, AAR uses its close-to-the-customer business model to serve aviation and defense customers through four operating segments: Aviation Supply Chain; Maintenance, Repair and Overhaul; Structures and Systems and Aircraft Sales and Leasing. More information can be found at https://www.aarcorp.com.
AAR will hold its quarterly conference call at 7:30 a.m. CST on December 17, 2008. The conference call can be accessed by calling 866-227-1582 from inside the U.S. or 703-639-1129 from outside the U.S. A replay of the call will be available by calling 888-266-2081 from inside the U.S. or 703-925-2533 from outside the U.S. (access code 1307543) from 11:00 a.m. CST on December 17, 2008 until 11:59 p.m. CST on December 24, 2008.
This press release contains certain statements relating to future results, which are forward-looking statements as that term is defined in the Private Securities Litigation Reform Act of 1995. These forward-looking statements are based on beliefs of Company management, as well as assumptions and estimates based on information currently available to the Company, and are subject to certain risks and uncertainties that could cause actual results to differ materially from historical results or those anticipated, including those factors discussed under Item 1A, entitled "Risk Factors", included in the Company's May 31, 2008 Form 10-K. Should one or more of these risks or uncertainties materialize adversely, or should underlying assumptions or estimates prove incorrect, actual results may vary materially from those described. These events and uncertainties are difficult or impossible to predict accurately and many are beyond the Company's control. The Company assumes no obligation to update any forward-looking statements to reflect events or circumstances after the date of such statements or to reflect the occurrence of anticipated or unanticipated events. For additional information, see the comments included in AAR's filings with the Securities and Exchange Commission.
    AAR CORP. and Subsidiaries

    Consolidated Statements of Operations
    (In thousands except per share data)

                             Three Months Ended          Six Months Ended
                                 November 30,                November 30,
                             2008            2007        2008           2007
                                 (Unaudited)                 (Unaudited)
    Sales                   $353,572       $310,647    $713,476      $616,607
    Cost and Expenses:
      Cost of sales          283,730        250,297     576,496       499,717
      Cost of sales,
       impairment             21,033           ----      21,033          ----
      Selling, general
       and administrative     38,205         30,941      75,003        61,603

    Earnings from joint
     ventures                  4,364          1,965       5,812         2,985

    Operating income          14,968         31,374      46,756        58,272

    Gain on extinguishment
     of debt                  22,098              0      23,208             0

    Interest expense           4,981          5,026       9,654         9,364
    Interest income and other    496          1,003         862         1,586
    Income from continuing
     operations before
     income taxes             32,581         27,351      61,172        50,494

    Income tax expense        11,229          9,463      21,089        17,351
    Income from continuing
     operations               21,352         17,888      40,083        33,143

    Discontinued Operations:
      Operating loss, net
       of tax                    215             33         546          135
      Loss on disposal,
       net of tax              1,403           ----       1,403         ----
    Net income               $19,734        $17,855     $38,134      $33,008


    Share Data:

    Earnings per share -
     Basic:
      Earnings from
       continuing operations   $0.56          $0.49       $1.05        $0.90
      Loss from
       discontinued
       operations              (0.04)          ----       (0.05)        ----
      Earnings per share -
       Basic                   $0.52          $0.49       $1.00        $0.90

    Earnings per share -                       -
     Diluted:
      Earnings from
       continuing operations   $0.51          $0.42       $0.95        $0.78
      Loss from
       discontinued
       operations              (0.04)           ---       (0.04)         ---
      Earnings per share -
       Diluted                 $0.47          $0.42       $0.91        $0.78

    Average shares
     outstanding - Basic      38,079         36,841      38,088       36,858
    Average shares
     outstanding - Diluted    42,802         43,732      42,877       43,770


    Consolidated Balance Sheet Highlights
    (In thousands except per share data)

                         November 30,      May 31,
                             2008           2008
                                       (Derived from
                                      Audited financial
                          (Unaudited)    statements)
    Cash and cash
     equivalents            $121,764       $109,391
    Current assets           837,808        783,431
    Current liabilities
     (excluding debt
     accounts)               176,807        195,505
    Net property, plant
     and equipment           149,753        146,435
    Total assets           1,382,013      1,362,010
    Total recourse debt      485,597        479,544
    Total non-recourse
     obligations              41,321         51,368
    Stockholders' equity     620,794        585,255
    Book value per share      $16.05         $15.09
    Shares outstanding        38,670         38,773


    Sales By Business Segment
    (In thousands - unaudited)

                              Three Months Ended         Six Months Ended
                                  November 30,              November 30,
                              2008           2007         2008        2007
    Aviation Supply Chain   $146,082       $144,784    $299,596     $287,492
    Maintenance, Repair &
     Overhaul                 87,437         68,679     173,747      131,326
    Structures and Systems   114,712         79,783     231,481      156,281
    Aircraft Sales and
     Leasing                   5,341         17,401       8,652       41,508
                            $353,572       $310,647    $713,476     $616,607


    Gross Profit By Business Segment
    (In thousands - unaudited)

                               Three Months Ended         Six Months Ended
                                  November 30,               November 30,
                               2008           2007        2008         2007
    Aviation Supply Chain    $35,965        $34,970     $71,362      $66,934
    Maintenance, Repair &
     Overhaul                 13,503          9,921      26,256       17,961
    Structures and Systems    18,856         10,784      36,310       19,905
    Aircraft Sales and
     Leasing                 (19,515)*        4,675     (17,981)*     12,090
                             $48,809        $60,350    $115,947     $116,890

    * Includes $21 million aircraft impairment charge


    Diluted Earnings Per Share Calculation -
    Earnings from Continuing Operations
    (In thousands except per share data - unaudited)

                               Three Months Ended         Six Months Ended
                                   November 30,             November 30,
                               2008           2007        2008         2007
    Income from continuing
     operations as reported  $21,352        $17,888     $40,083      $33,143
    Add: After-tax interest
     on convertible debt         377            491         761          983
    Income from continuing
     operations for diluted
     EPS calculation         $21,729        $18,379     $40,844      $34,126

    Diluted shares
     outstanding              42,802         43,732      42,877       43,770

    Diluted earnings per
     share from continuing
     operations                $0.51          $0.42       $0.95        $0.78
Note: Pursuant to SEC Regulation G, the Company has included the following reconciliations of financial measures reported on a non-GAAP basis to comparable financial measures reported on the basis of Generally Accepted Accounting Principles ("GAAP"). The Company believes that the adjusted gross and operating profit margin percentages for the three month period ended November 30, 2008 are more representative of the Company's ongoing performance as it excludes the impairment charge
    AAR CORP.                                      Three Months Ended
    (In thousands)                                 November 30, 2008
    Gross margin as reported                            48,809
    Impairment charge                                   21,033
Gross margin adjusted for impairment charge 69,842
Gross margin % as reported 13.8%
Gross margin % adjusted for impairment charge 19.8%
    Operating Income as reported                       $14,968
    Impairment charge                                   21,033
Operating Income adjusted for impairment charge $36,001
Operating margin as reported 4.2%
Operating margin adjusted for impairment charge 10.2%
CONTACT: Richard J. Poulton, Vice President, Chief Financial Officer of AAR, +1-630-227-2075, rpoulton@aarcorp.com
Related news
See all
April 11, 2024
AAR signs extension and expansion of V2500 engine component distribution agreement with Sumitomo Precision Products
Wood Dale, Illinois — AAR CORP. (NYSE: AIR), a leading provider of aviation services to commercial and government operators, MROs, and OEMs, has signed an extension and expansion of its V2500 engine component distribution agreement with Sumitomo Precision Products Co., Ltd. (SPP).
April 09, 2024
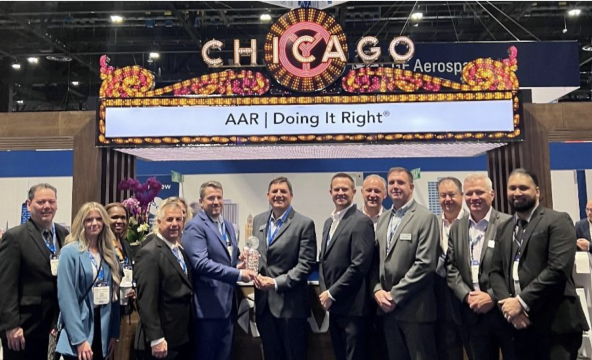
AAR awarded Supplier of the Year by Atlas Air Worldwide
Wood Dale, Illinois — AAR CORP. (NYSE: AIR), a leading provider of aviation services to commercial and government operators, MROs, and OEMs, was awarded the 2023 Component Repair Supplier of the Year – Large Volume Category by Atlas Air Worldwide (Atlas Air).
April 05, 2024
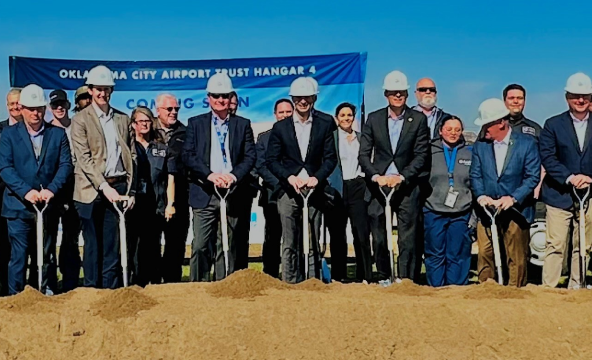
AAR breaks ground on MRO facility expansion in Oklahoma City
Wood Dale, Illinois — AAR CORP. (NYSE: AIR), a leading provider of aviation services to commercial and government operators, MROs, and OEMs, broke ground on the expansion of its maintenance, repair, and overhaul facility in Oklahoma City earlier today.


